The Mathematical Association of NSW’s (@MathsNSW) annual Pre K-8 conference was held last Friday and Saturday. What a wonderful opportunity it was to meet up with other teachers and educators to chat and learn about mathematics. Last year the conference was unable to go ahead so it’s been a while since could meet together face-to-face for large gathering professional learning. This year saw a new format where the conference was extended to two-days, Friday included masterclass sessions while Saturday followed the usual format of keynotes and a wide selection of workshops to attend. This blog includes some of my reflections on the two days. To check out what other attendees shared, search #noticingthemaths on Twitter.
Excited to be attending a mathematics conf in person! @MathsNSW @AmberBidwell1 @glasgow_ruth @attard_c #noticingthemaths pic.twitter.com/2EYUt1abiK
— katherin cartwright (@kath_cartwright) March 25, 2021
The Friday consisted of four masterclass sessions by two brilliant leaders in research and development of support materials for teachers in mathematics – Charles Lovitt (developer of Maths300) and Dr Catherine Attard (@attard_c, engagingmaths, Associate Professor at Western Sydney University). We were fortunate enough to have Charles be able travel from Melbourne to present at the conference. Charles share his wealth of knowledge of successful lessons that have been revised, adapted and extended over time. During 2020 Catherine had the privilege of teaching primary students one day a week for 6 months at Metella Road PS (@MetellaRdPS). Students from two classes came along to the conference and Catherine taught two problem-solving lessons live.
Masterclass 1: Charles Lovitt
If you don’t already have a subscription to Maths300 at your school, then you should. I’ve seen Charles present many times on the successful lessons he and his colleagues have developed, or ‘collected’ as Charles calls it, and I always learn new ways to apply them or hear of how the lesson has been recently enriched by other teachers. His examples of Dice Footy (using number and probability associated with AFL), Temperature maps (using prior knowledge and connections to geography to determine city’s temperatures), Hunting for stars (a concrete representation of patterns in skip counting and multiples) and the classic Architect’s task/problem (exploring building houses using only four blocks) all showed how an investigation grows with students’ interest, ability, and engagement.
Masterclass with the fabulous Charles Lovitt looking at lessons with purposeful mathematics! @mathsnsw #noticingthemaths pic.twitter.com/zAQPLStw7V
— Fiona Foley (@Fiona_Foley) March 26, 2021
Some of the examples he shared could , and should, be explored over several lessons where the knowledge, skills and understanding build each day and connect to what was previously learned.
Charles loves sharing lessons he’s seen other teachers teach, having those moments of ‘why didn’t I think of that’ as they take the lesson on other tangents from what he had seen or used before. His masterclass engaged participants in noticing the mathematics, the connections, and potential of tasks when you notice the decisions teachers make to change and improve the lesson. All the lessons Charles shared can be further enriched with the use of technology, and are part of the Maths300 suite.
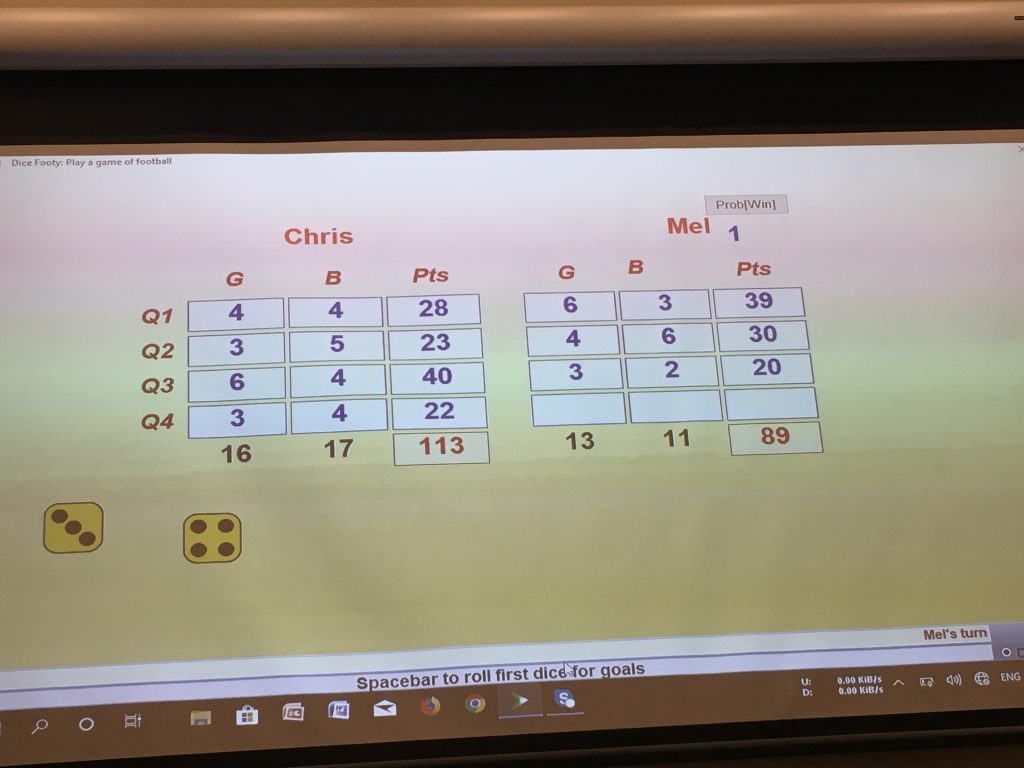
Dice Footy – In pairs we rolled a six-sided dice twice to get a score for goals (x 6 points) and behinds (x 1 point) for each quarter of the game. The data collected from all the games was compared. Asking questions such as who scored the most? the least? were there any draws? Charles then extended it to investigate who, by the end of the third quarter, could still win. He shared how this can be explored using technology via Maths300. It was great as we all rolled to see if we could roll a win for Mel, before seeing the outcome on the computer.
You can then investigate further what the average score in a match might be by increasing the games up to 1000, 10 000, and 100 000 – something quite impossible to easily replicate physically in the classroom.
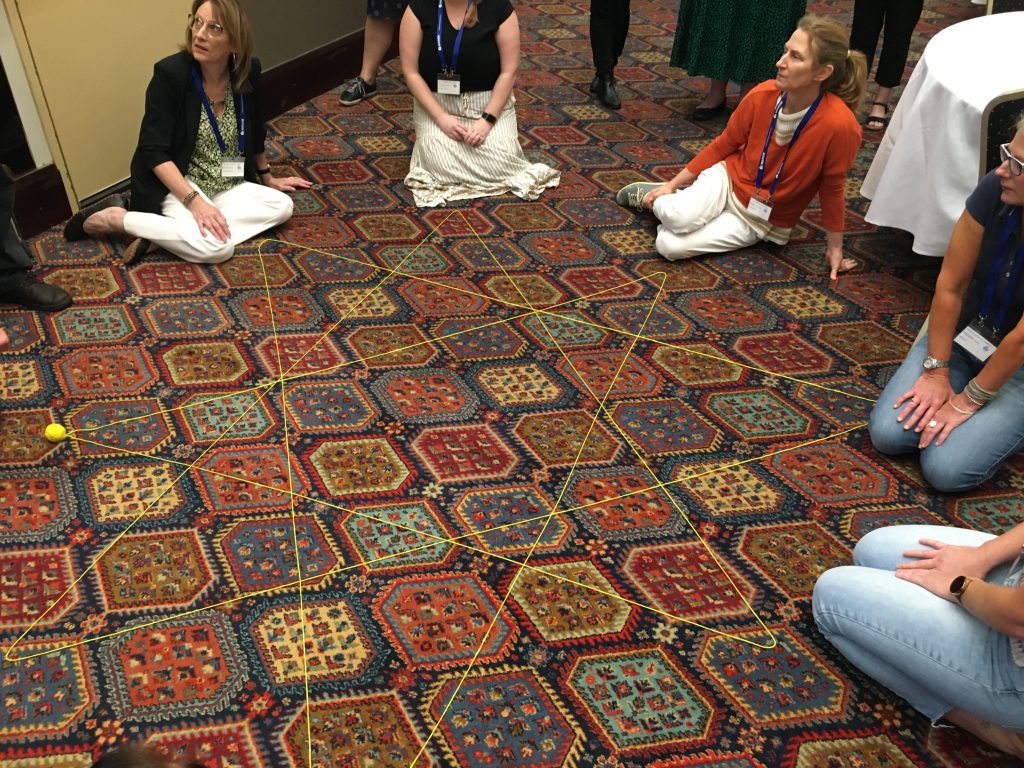
Hunting for stars – I’ve taught lessons before where you use a circle to explore multiples and the pattern the final digits make (in Talking about Patterns and Algebra). Charles’ version with wool being passed around the circle was a good task to do prior to do the pattern making by drawing. Charles had 8 students, throwing to every 3rd person to make the pattern. He posed the question: What if we have 9 students? – predict the shapes.
This task is a great transition from concrete, to visual, to drawing, then to technology. It also reminded me of the Questacon room where you can use the life-sized harmonograph to see patterns being formed.
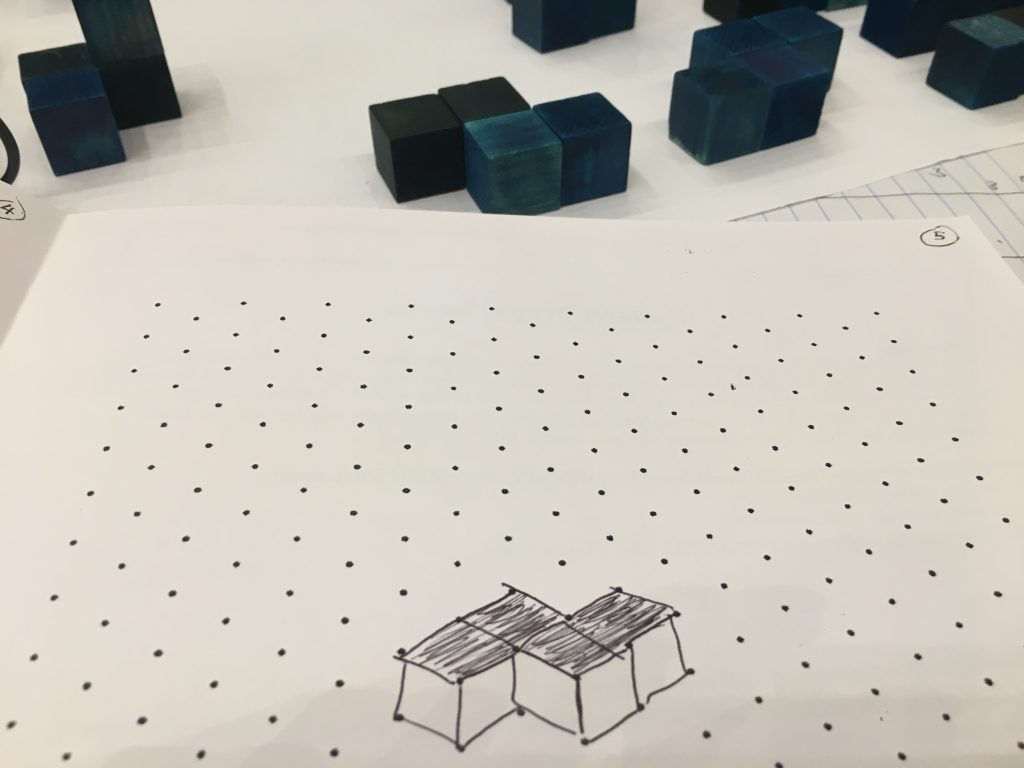
The Architect’s problem is probably my favourite. I’ve used versions of this task many times along with similar tasks that explore pentominoes and open boxes (and the painted cubes with @BUBBLINGDAY). These spatial tasks focus on symmetry, 3D and 2D and the connections between building in 3D and drawing in 2D. The task starts with a story about a developer building on a block in a local street. Charles continues to extend the task by asking questions. The first is to see how many houses you can build using only 4 cubes. How do you know you have them all? Then, draw the plans for the houses using isometric paper.
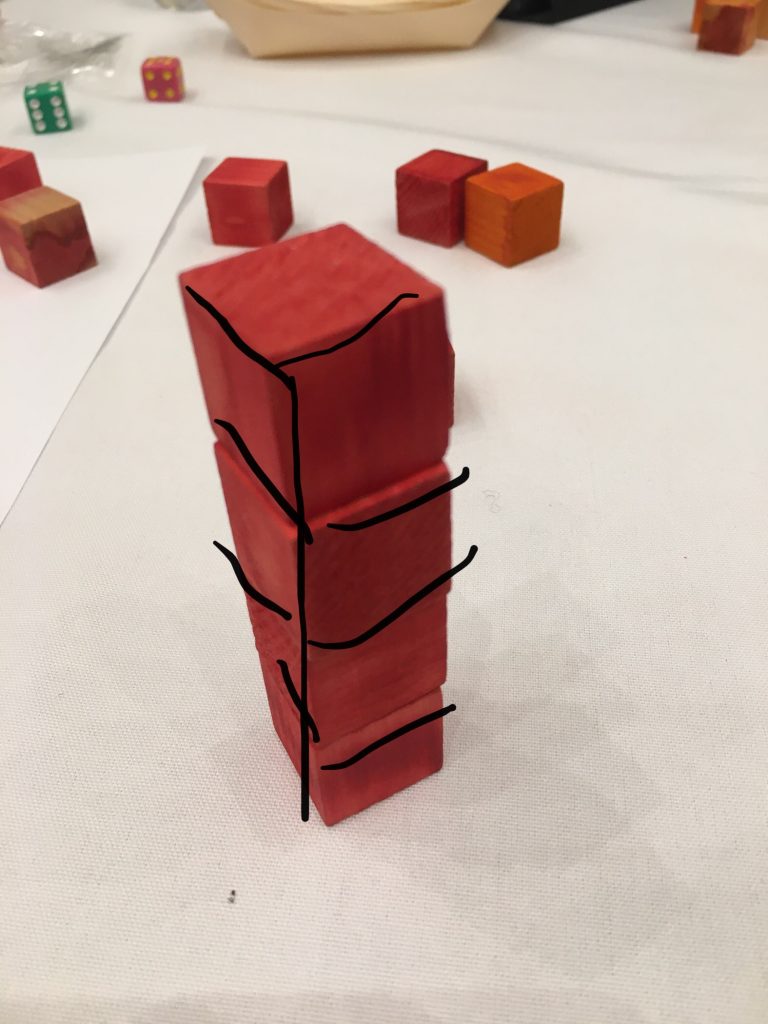
The lesson can extend further to investigate the cost of the houses, painting them, and ensuring they are eco-friendly. For students who might struggle with the drawing aspect, I would suggest taking a photo of the building, using the edit feature on the phone or iPad, click on the ellipsis to then be able to ‘mark up’ the photo so students can easily see the edges.
Masterclass 2: Catherine Attard
Catherine’s focus in her masterclasses was using problem solving to focus on students’ reasoning, students’ flexibility with strategies to get past the ‘maths’ (calculations) to generalising and making connections. Her lessons were trying to work with students to know how to apply the mathematics. In her masterclasses, during the live lesson she provided some direction for participants observations during the lesson:
- Noticing the mathematics
- Pedagogical and dialogic moves
- Opportunities to provide enabling and extending prompts
- Feedback
- Explicit teaching opportunities
- Assessment opportunities
- Student engagement (cognitive, operative, affective)
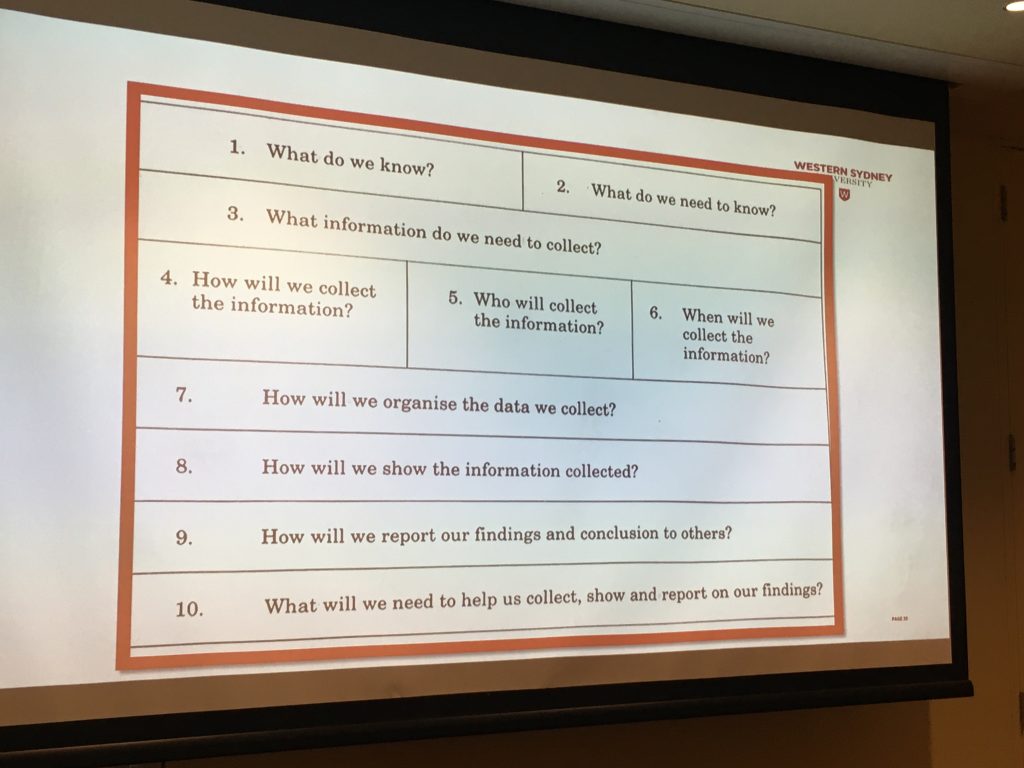
The lesson was with a Year 4/5 class and was about one hour long, there was then about an hour for a post-lesson discussion about what the teachers’ noticed. The lesson started by Catherine hooking students into their prior learning they had done the week before on measuring and exploring do right handers have a larger left foot? Catherine asked probing questions like:
- What did you have to do? response measuring, gather data
- What did you have to do with the data? response record, create a table
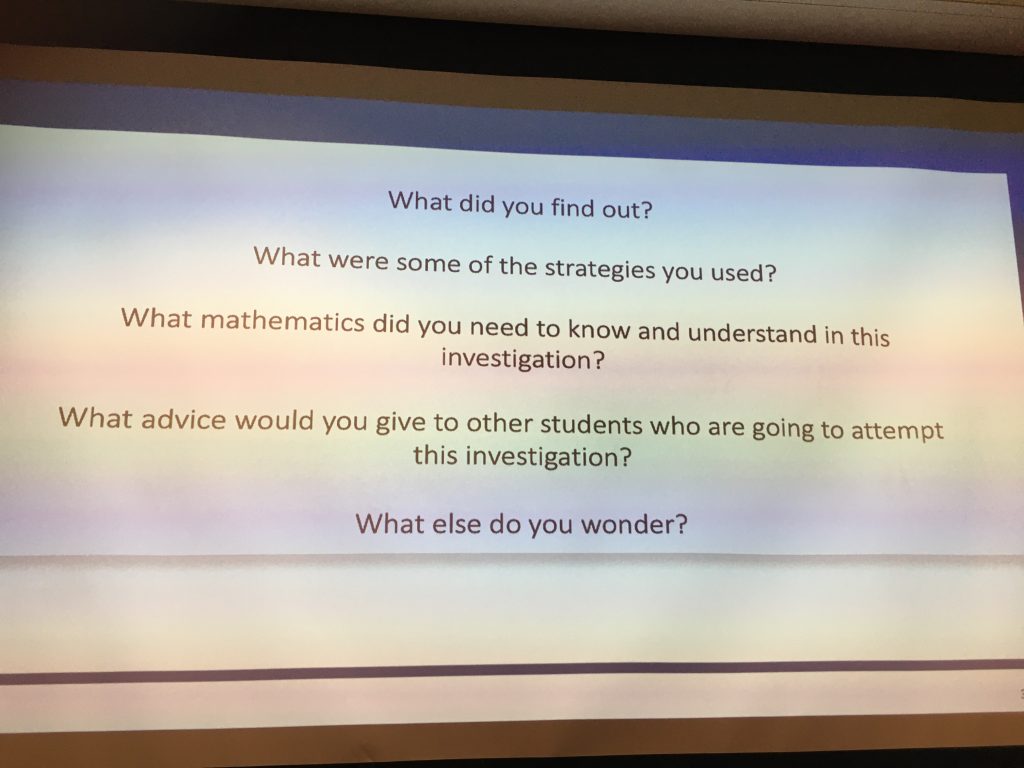
- What did you find out? Any conclusions?
- We are going to apply some of the skills from last time, what were some of the issues?
response not starting from zero, the importance of being accurate
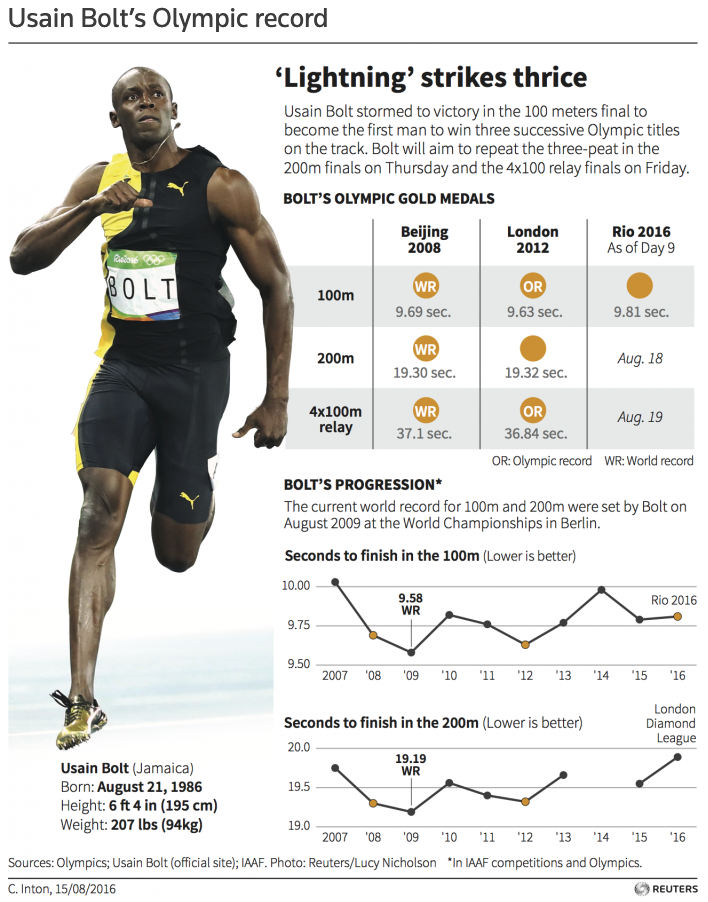
Catherine then showed the students an infographic (pictured) about Usain Bolt. After asking the students what they noticed and what they wondered about the data, they were posed this question: Does the tallest person have the longest stride?
The context of the lesson meant that it was about the students, they set out to discover the answer using their own data collected in small groups. The following is an excerpt from my noticing notes about the teacher’s (Catherine’s) actions that show the way she guided the lesson but didn’t over-instruct, questioned students but didn’t tell them the answer, prompted students but didn’t tell them how to do it.
Questions posed during the launch of the lesson:
- What is the first thing that we do? (Understand the problem)
- What is the first thing we might need to clarify?
- What does stride mean?
- Is it a normal step, is it more like a leap?
- How are we going to work that out?
- Do we all need to work out what a stride is so we can compare our results?
Catherine then restated the question and clarified some important points such as:
- We need to make sure that you write down all your working out and thinking
- Student suggested “my stride might not always be the same so we might need to find the average stride first”
- Class teacher (Elise) clarified that you need to make sure those in your group have different heights
- Do it in groups then report back (groups of 4)
- May not get to the absolute solution that’s ok
- I will call you back and ask you to share and then we can make some conjectures
Catherine made it clear they she would ‘check in’ with students a few times during the lesson. In the after lesson discussion, one observing teacher noticed that the first intentional check-in by Catherine focused on “what’s your plan”, whereas the second intentional check-in focused on “what have you found out so far, how does that help us answer the question?” These check-ins and Catherine’s questions are deliberate teacher moves that are generally planned prior to the lesson and are markers of effective teacher practice.
There was much to notice about how Catherine moved around the room, visiting groups, prompting them to share their ideas, observing groups in a way that could be interpreted as a form of ongoing assessment – observing students ability to use a rule or tape measure, how are they comparing and recording results, have they made a decision on an efficient strategy, what are their methods for ensuring the data is accurate and consistent. At the end of the lesson, or the end of where the students’ investigation got up to, there was a summarise time based on questions Catherine shared.
It was a great lesson and the students were totally engaged at all times with the investigation. It was the start of what might take another two or three lessons to find conclusions for. Some of the students early conclusions and comments were:
- The tallest did have the longest stride – some others debated saying it might not be true
- Even if the tallest person did have the longest stride, the shortest might have the second longest stride
- Our first strategy was pretty efficient but then we started measuring and found out it was too hard. Had trouble finding the best was to figure it out.
- Some groups reported they are still measuring and need more time before they can make a hypothesis
- I wondered if I walk faster, my speed, if I walk faster would my stride by larger?
Some of my own wonderings about where the lesson could go were: use a scatter plot with post it notes as they are comparing two variables (could do this with students in a physical way even though this type of data comparison appears in later curriculum), do a follow up lesson using the iPad to video the walking of students and use digital ruler to measure the strides – more accurate, I’m also wondering if it’s more about the length of legs than the height as many tall people have long torsos but may not have longer legs.
Catherine and Charles also presented a panel session at the end of the day hosted by Amber Bidwell (@AmberBidwell1), the chair of the PAM (PreK And Middle years committee of MANSW) where they answered a range of questions. Well, that was the end of day one! I will post a Part 2 blog in two weeks that shares some of the workshops and Peter Sullivan’s keynote from Day 2 of the PreK-8 MANSW conference.
Afternoon panel session with Charles and @attard_c led by @AmberBidwell1 @MathsNSW. What’s the biggest misconception in mathematics? “The misunderstand that there are maths people and non-maths people”. Thanks Catherine. Totally agree. #noticingthemaths pic.twitter.com/NuzcwQNdzS
— katherin cartwright (@kath_cartwright) March 26, 2021
